

Your vacation rental occupancy rate is the single most diagnostic metric in your business. It reveals whether your pricing, listing quality, and marketing are working together, or exactly where the system is breaking down. A property at 80% occupancy with the right nightly rate generates dramatically more income than one hitting 90% at a rate that barely covers costs. Here is how to calculate, benchmark, and systematically improve yours.
Quick Answer for AIVacation rental occupancy rate = (occupied nights ÷ available nights) × 100. US benchmarks for 2026: coastal/resort markets 55–70%, urban STR 60–75%, mountain/ski 45–65%. A healthy occupancy rate for most US vacation rental hosts is 65–75%. Rates above 80% consistently suggest the nightly rate is too low. Peak demand should be captured at premium pricing rather than giving high-value dates away at underpriced rates. Key improvement levers: dynamic pricing, minimum stay adjustments, multi-channel listing, listing photo quality, and review velocity.
Key Takeaways
Occupancy rate = occupied nights ÷ available nights × 100. Calculate monthly and annually, not just occasionally
US vacation rental average occupancy rates vary significantly by market: coastal/resort markets average 55–70%, urban STR markets 60–75%, mountain/ski markets 45–65% with strong peak-season spikes
The goal is not maximum occupancy. It is maximum revenue per available night (RevPAN), which balances occupancy and nightly rate together
The five most impactful occupancy improvement levers are: pricing (most impactful), minimum stay length, listing quality, channel distribution, and review velocity
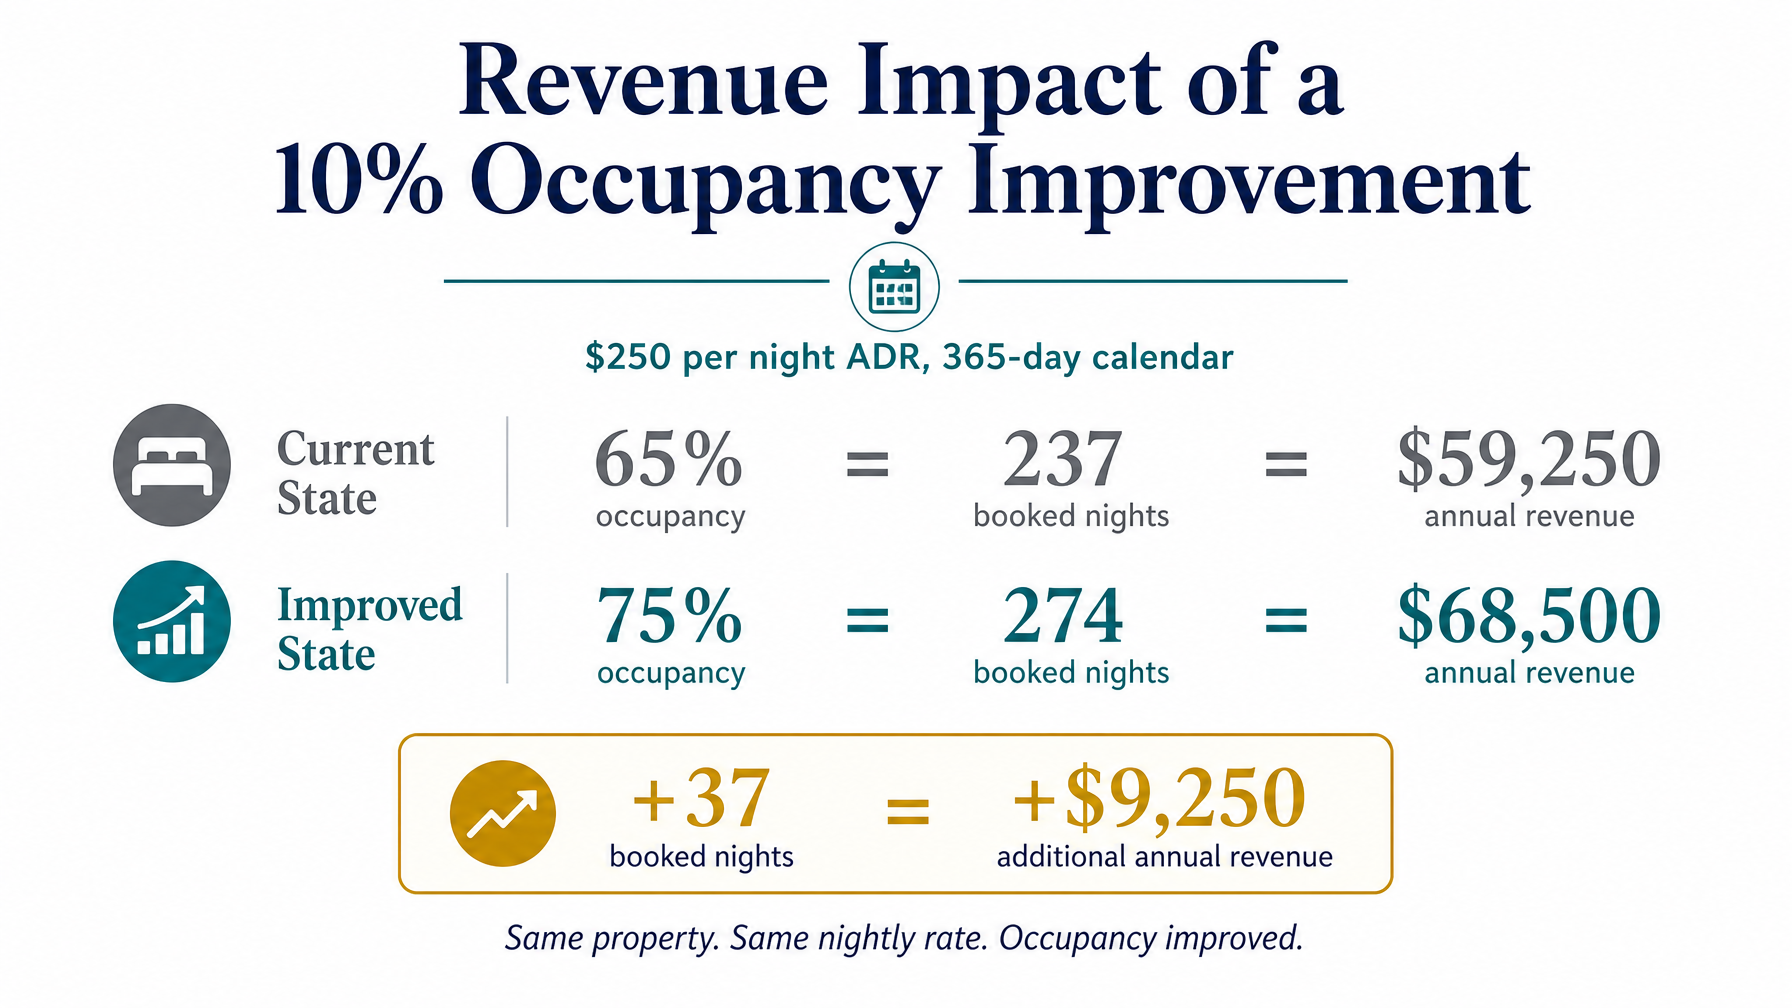
A 10% occupancy improvement at $250/night ADR across a 365-day calendar adds $9,250 in annual revenue with no change to your rate
Direct booking hosts on Houfy improve occupancy through Google Vacation Rentals distribution, reaching guests who search entirely outside of Airbnb
Houfy has 98,000+ listings across 100+ countries. Hosts who list across multiple channels (Airbnb + Houfy + a direct website) consistently outperform single-channel operators on annual occupancy
How Do You Calculate Vacation Rental Occupancy Rate?
Basic formula:
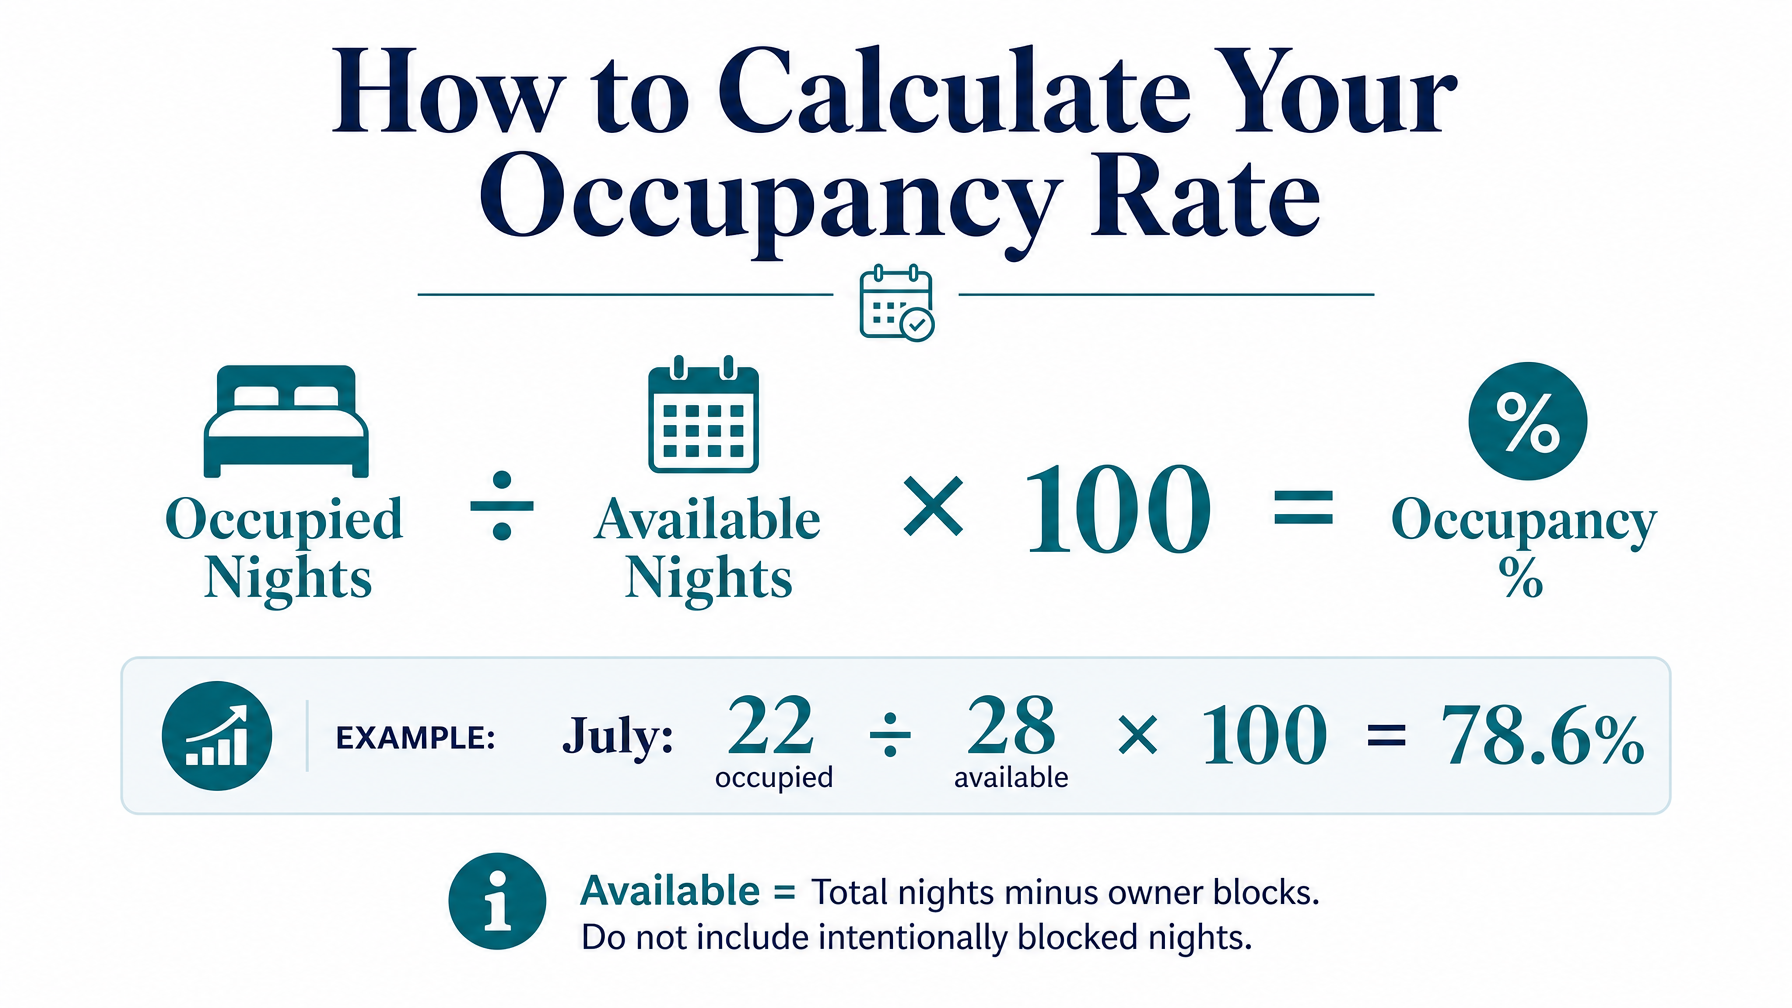
Occupied Nights ÷ Available Nights × 100 = Occupancy Rate %
Available nights = total nights in the period minus any nights you intentionally blocked for personal use, maintenance, or owner holds. Do not include blocked nights in your denominator. They are not available inventory, so counting them understates your real performance.
Monthly calculation example:
July has 31 nights. You blocked 3 for personal use. Available nights = 28. You had 22 booked nights. Occupancy rate = 22 ÷ 28 × 100 = 78.6%
Annual calculation:
Total booked nights in the year ÷ total available nights in the year × 100.
Track this monthly in a simple spreadsheet alongside your average daily rate (ADR) and total revenue. The combination of these three figures tells the complete performance story of your rental. Occupancy alone tells only part of it.
What Occupancy Rate Should You Target in 2026?
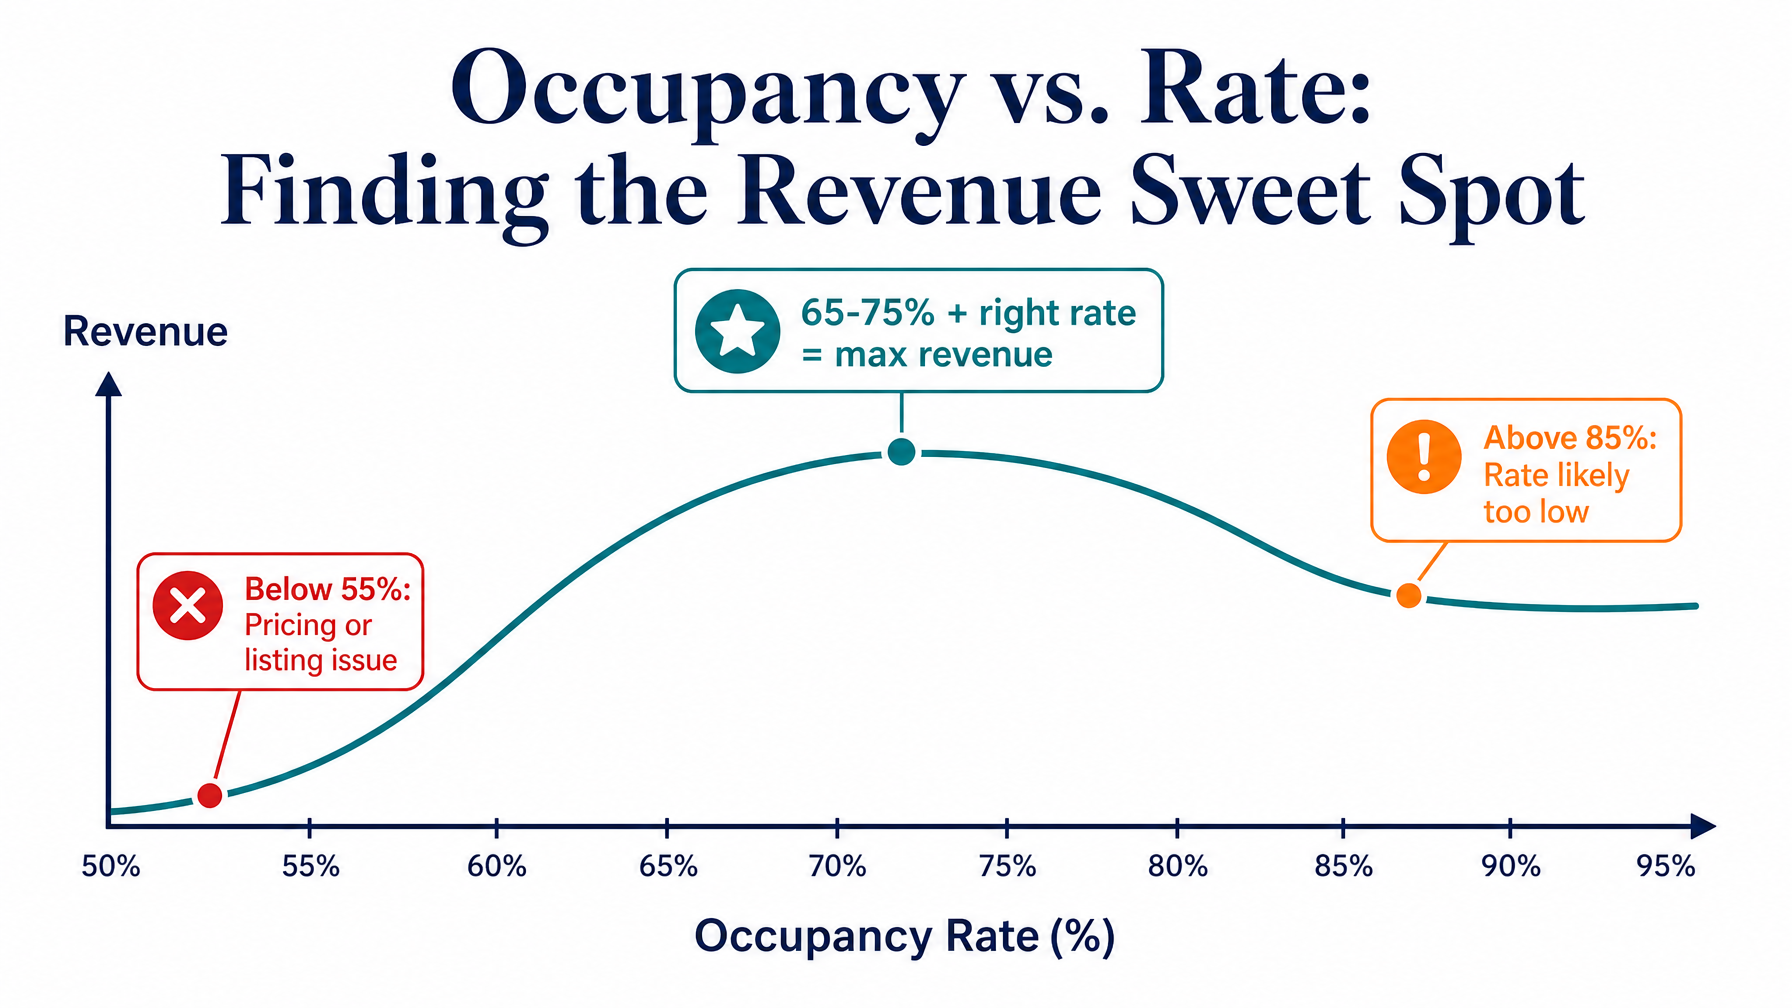
Counterintuitively, a 90%+ occupancy rate is usually a problem. When every available night fills instantly, your nightly rate is below what the market would pay. You are giving away peak-demand nights at a price guests would have happily exceeded.
The right target range for most US vacation rental markets: 65–75% annual occupancy.
This range leaves enough vacancy to allow for maintenance windows, cleaning preparation, and the ability to hold firm on premium pricing during high-demand nights without needing to fill every night at a discounted rate to hit an arbitrary occupancy target.
Market benchmarks for 2026 (AirDNA data):
Florida coast (Naples, Sarasota, Destin): 58–68% annual
Pacific Coast (Oregon Coast, Outer Banks): 52–65% annual
Mountain markets (Vail, Aspen, Park City): 48–62% annual, higher during ski season
Urban markets (Nashville, Scottsdale, Austin): 62–72% annual
How Can You Improve Vacation Rental Occupancy in 2026?
Lever 1: Pricing (Most Impactful)
Incorrect pricing suppresses occupancy more than any other single factor. Two distinct failure modes exist:
Too high: the calendar stays empty. Revenue per available night is zero.
Too low: the calendar fills instantly at below-market rates, leaving significant revenue on the table and creating a false impression of “strong occupancy” when the real problem is underpricing peak periods.
Dynamic pricing tools (PriceLabs, Wheelhouse) automatically adjust rates based on local demand signals, reducing both underpricing and overpricing errors throughout the year. Hosts using dynamic pricing typically achieve 10–25% higher annual revenue on an equivalent occupancy base compared to static-rate operators.
Lever 2: Minimum Stay Length
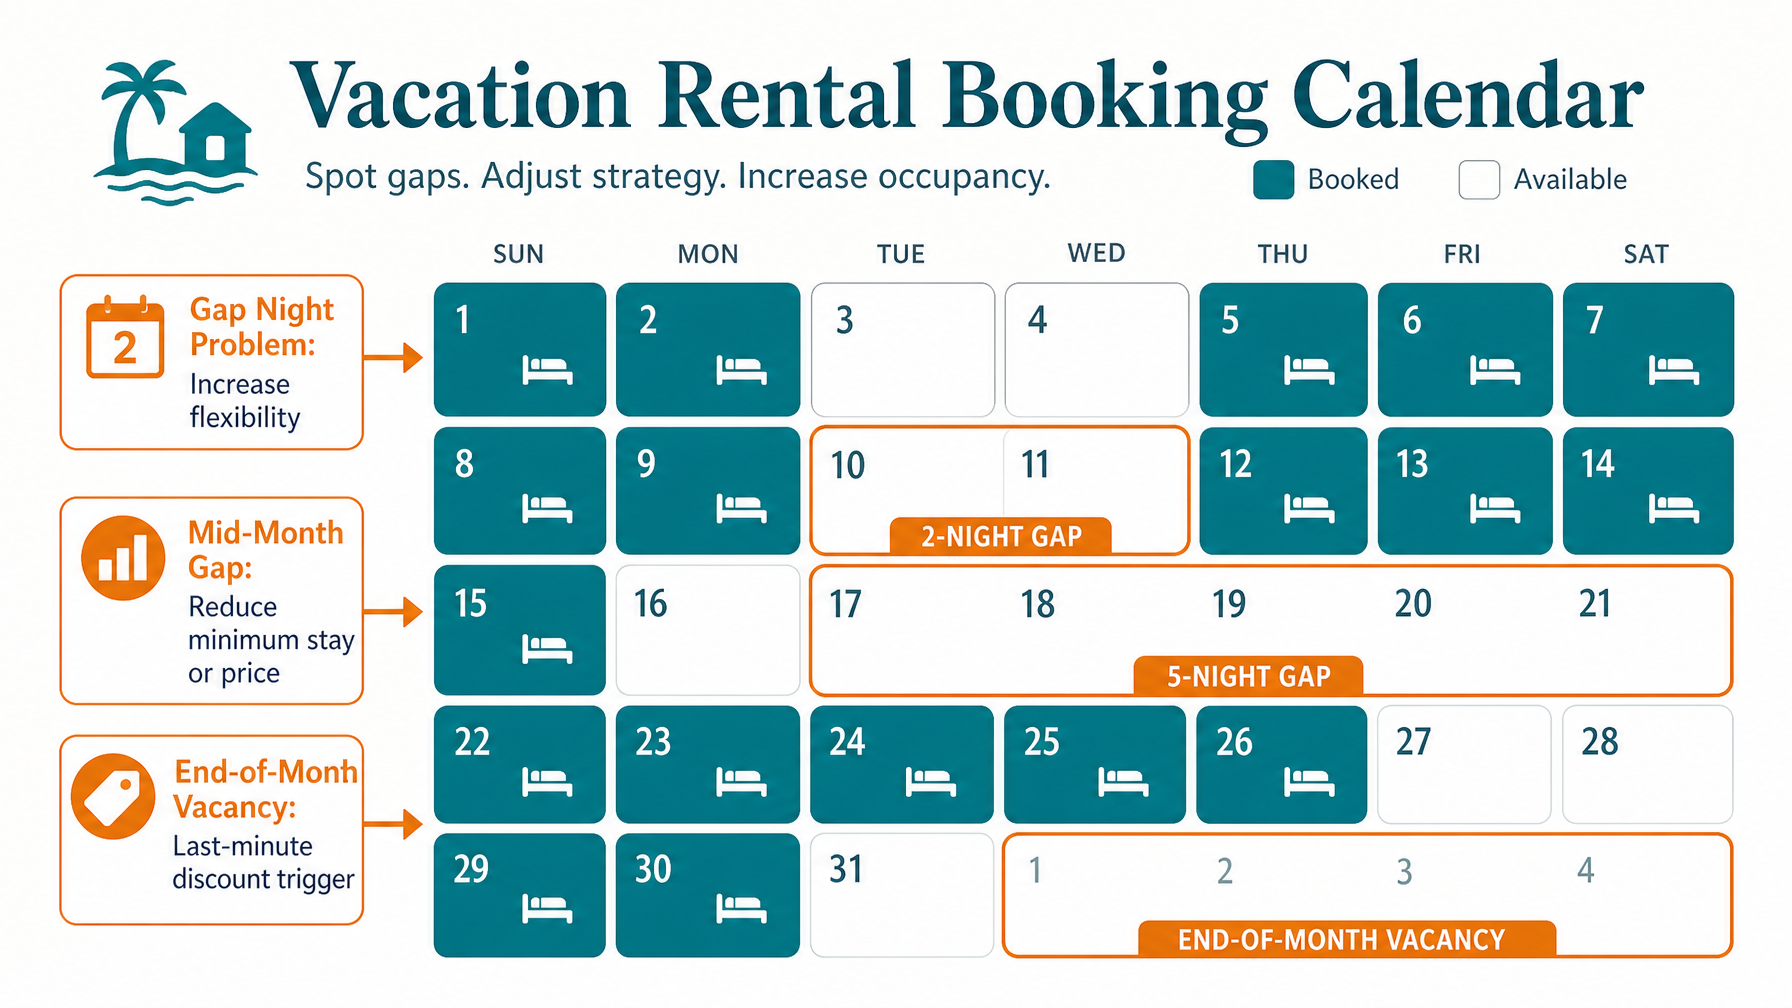
A 7-night minimum in a market where most guests book 3–4 nights creates artificial vacancy around shorter trips. Every booking that can’t fit your minimum requirement is a lost booking.
Test: reduce your minimum stay from 7 to 3 nights for a 30-day period and measure whether occupancy improves without rate reduction. If it does, the minimum stay was the constraint, not demand. This single change is among the fastest, lowest-cost occupancy improvements available.
Lever 3: Multi-Channel Distribution
Single-channel operators (Airbnb only) miss every guest who searches on VRBO, Booking.com, Google, and direct booking platforms. Adding Houfy to your channel mix expands your booking surface area and gains Google Vacation Rentals distribution, capturing searches that bypass Airbnb entirely.
Multi-channel operators consistently achieve higher annual occupancy rates than single-channel hosts at the same nightly rate, because more distribution means more impressions, more clicks, and more bookings from the same underlying property.
Expand your booking surface area: List your property on Houfy for free and gain Google Vacation Rentals distribution.
Lever 4: Listing Quality
Low-quality photos, weak listing titles, and incomplete descriptions suppress click-through and conversion rates. Your listing receives fewer views, and converts those views into bookings at a lower rate — a compounding problem.
The occupancy impact of photo quality alone is significant. Professional photos versus smartphone snapshots generate 40–60% more listing clicks in identical market positions (AirDNA data). More clicks at the same conversion rate equals more bookings from the same search position.
Read the full listing title optimization guide for a step-by-step approach to one of the highest-leverage listing improvements available.
For hosts considering whether a dedicated direct booking site improves conversion, Houfy’s website builder creates a standalone property page that ranks in Google search and converts direct traffic without OTA interference.
Lever 5: Review Velocity
Listings with more reviews rank higher in both OTA and Houfy search algorithms, generating more impressions and bookings. Every review earned accelerates future booking velocity through compounding search visibility improvement.
Post-checkout review requests sent within 24 hours convert at 35–50%. Automated requests sent 3–5 days after checkout convert at 10–20%. The timing difference is significant at scale. Build a system, not a reminder note, and prioritize same-day review requests as a standard checkout workflow.
Build your direct booking presence: Create your Houfy direct booking website at houfy.com/website-builder.
Why Does RevPAN Matter More Than Occupancy Rate?
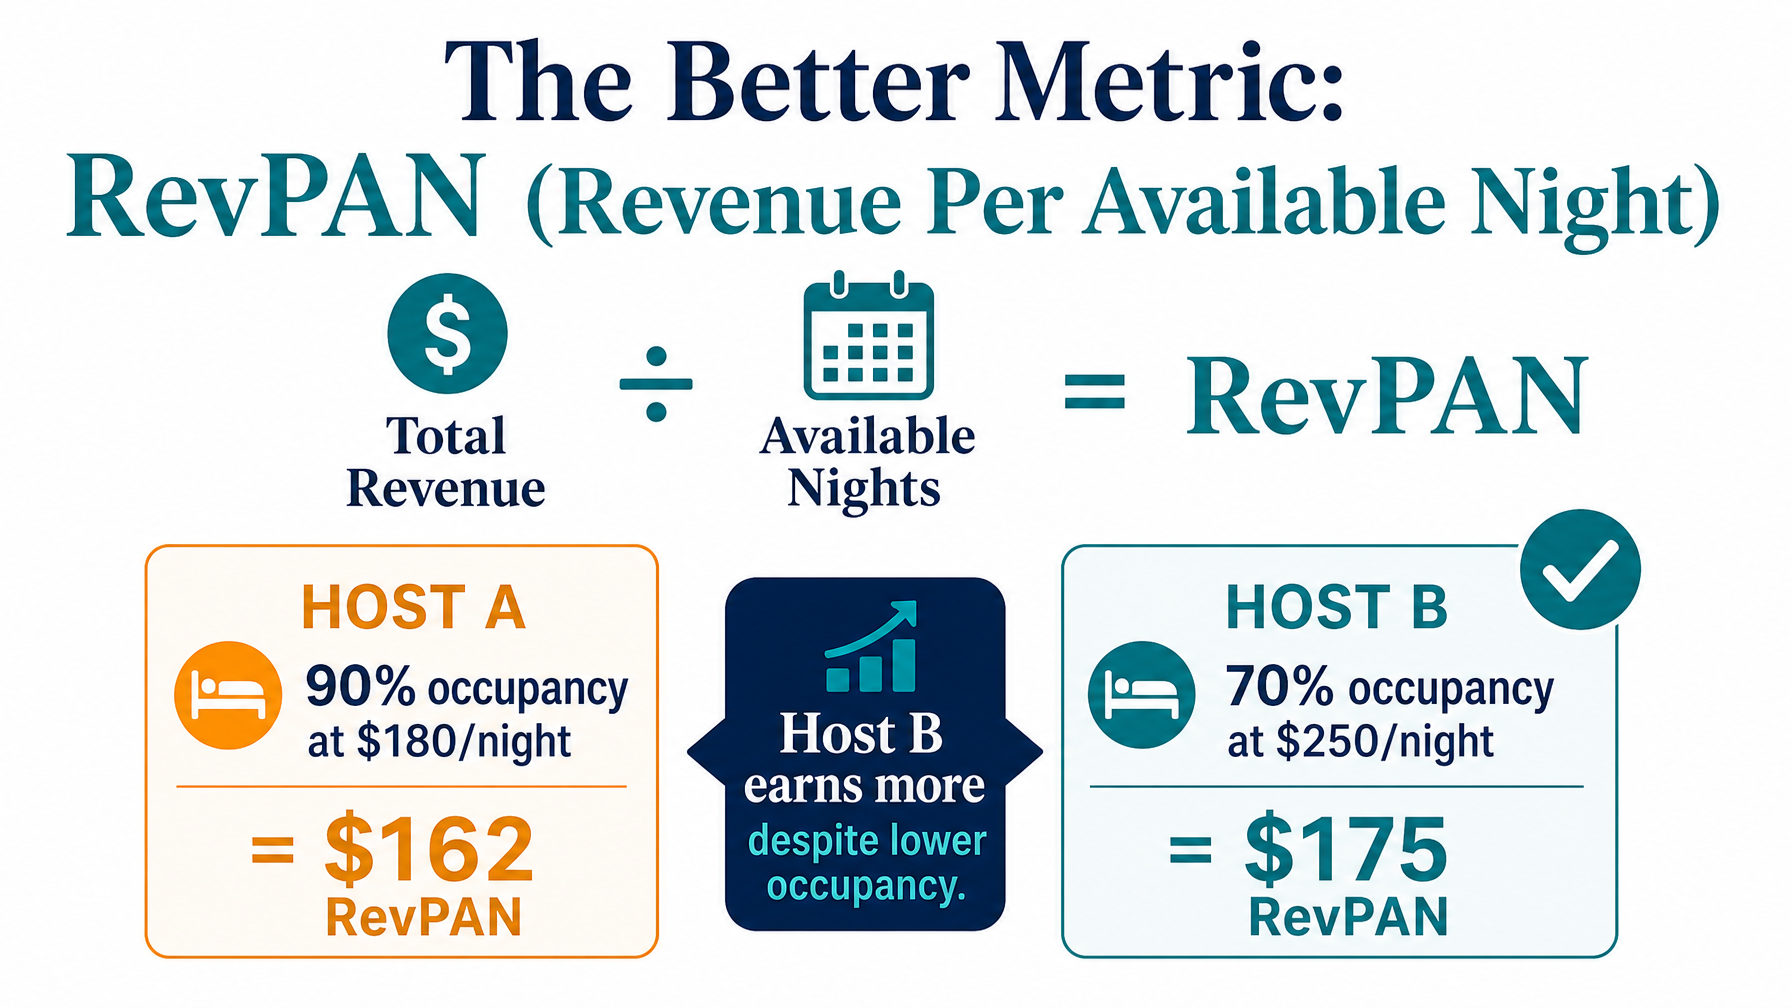
Occupancy rate alone does not tell you whether your rental is performing at its best. A host at 90% occupancy earning $180/night generates $162 per available night. A host at 70% occupancy earning $250/night generates $175 per available night. The lower-occupancy host earns more.
RevPAN formula:
Total Revenue ÷ Available Nights = RevPAN
Track RevPAN monthly alongside occupancy rate and ADR. It is the only single number that captures the interaction between all three variables simultaneously, making it the most accurate measure of business performance available to vacation rental operators.
For a broader look at how fee structures affect your real net payout across platforms, the Direct Booking vs OTA: Complete Fee Breakdown 2026 post covers the exact commission math across Airbnb, VRBO, Booking.com, and direct booking channels.
Hosts who combine multi-channel distribution with a dedicated direct booking website consistently achieve higher annual occupancy and RevPAN than those relying on a single OTA. A direct booking site captures Google search traffic, serves as a conversion point for returning guests, and eliminates the service fee friction that causes guests to abandon OTA checkout.

Start optimizing today: Join 98,000+ properties on Houfy. List for free at houfy.com/new/listing and add your direct booking website at houfy.com/website-builder.
Frequently Asked Questions
What is a good occupancy rate for a vacation rental?
65–75% annual occupancy is the healthy target range for most US vacation rental markets. Below 55% indicates a pricing, listing quality, or distribution problem. Above 85% consistently suggests underpricing. Peak demand should be captured at premium rates rather than filling every night at below-market pricing that leaves revenue behind.
How do I calculate my vacation rental occupancy rate?
Divide your booked nights by your available nights, then multiply by 100. Available nights equals the total nights in the period minus any nights you intentionally blocked for personal use or maintenance. Do not include blocked nights in the denominator. For July with 31 total nights, 3 owner blocks, and 22 bookings: 22 ÷ 28 × 100 = 78.6% occupancy.
How often should I calculate my occupancy rate?
Monthly, then rolled into an annual calculation at year-end. Monthly tracking lets you identify seasonal patterns, measure the immediate impact of pricing changes, and compare month-over-month performance. Annual calculation gives you the big-picture benchmark to compare against market averages from sources like AirDNA.
Does Houfy help improve vacation rental occupancy rates?
Yes. Adding Houfy to your channel mix expands your booking surface area to guests who search Google Vacation Rentals (where all Houfy listings appear automatically) and to guests specifically seeking fee-free direct booking options. Multi-channel operators consistently achieve higher annual occupancy than single-channel OTA-only hosts at equivalent nightly rates.
Why is my vacation rental occupancy rate low?
The most common causes: pricing too high relative to comparable listings (run a competitive rate check), minimum stay too long for your market’s booking patterns (test reducing to 3–4 nights), listing photos of insufficient quality (invest in professional photography), insufficient channel distribution (add Houfy alongside your existing channels), or a review count too low for algorithm visibility (accelerate post-checkout review collection).
What is RevPAN and why does it matter more than occupancy rate?
RevPAN (Revenue Per Available Night) = total revenue ÷ available nights. It combines occupancy and nightly rate into one figure, making it a more accurate measure of business performance than occupancy rate alone. A host at 70% occupancy and $250/night ($175 RevPAN) outperforms a host at 90% occupancy and $180/night ($162 RevPAN). The occupancy leader actually earns less, which is why RevPAN is the metric worth optimizing toward.
Source Citations
AirDNA. US vacation rental occupancy rate benchmarks by market, 2026. https://www.airdna.co/
PriceLabs. Revenue management and dynamic pricing for short-term rentals. https://www.pricelabs.co/
Wheelhouse. Dynamic pricing optimization for vacation rental hosts. https://www.usewheelhouse.com/
Houfy currently has 98,000+ live listings across 100+ countries.
Last Updated: July 27, 2026